In brief
- The question
- Can a private doctor network say anything reliable about disease nationwide?
- The test
- We compared dengue across 8.6 million consultations with two official records we don't control. Our trend matched them about as closely as they matched each other, and it held through a national system switchover.
- What it means
- It shows where a season is now, without waiting for official figures. It is not a forecast or a case count.
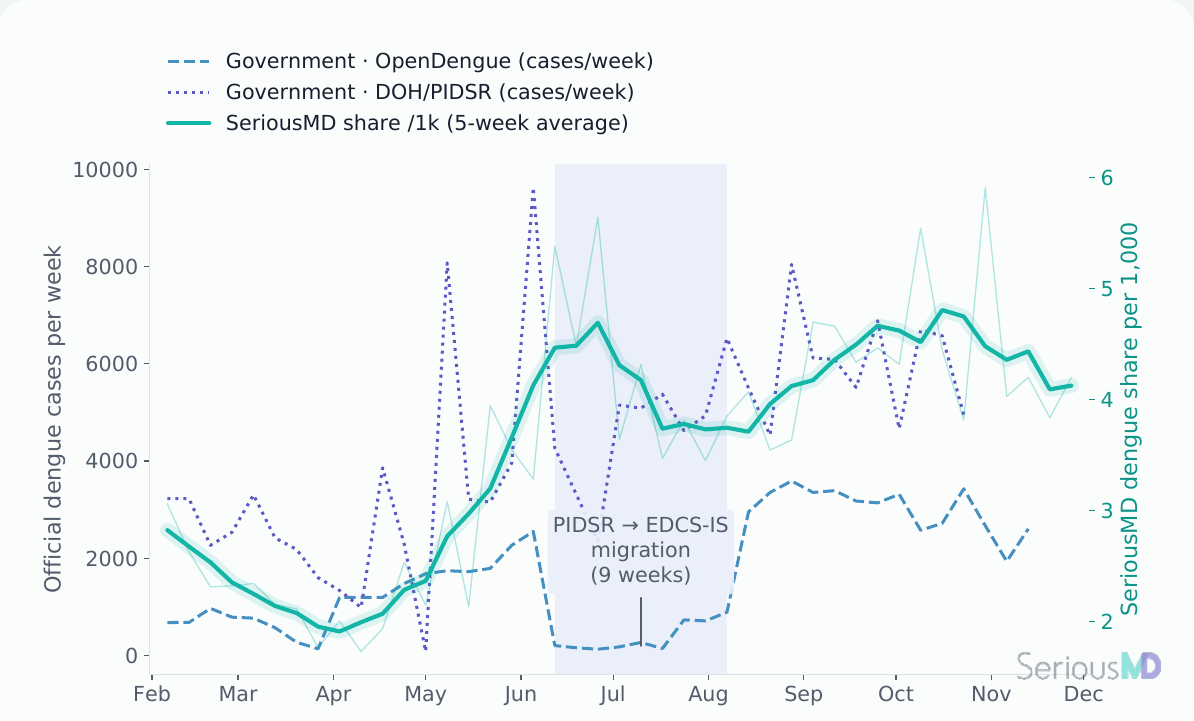
In mid-2023, the Philippines switched to a new national disease surveillance system. A switchover that big usually interrupts a published series while systems are cut over.
For nine weeks, the OpenDengue compilation shows that transition, right as the rainy season was building. The DOH/PIDSR weekly compilation kept publishing through the switchover. Our data held up alongside it.
Why dengue
When I joined SeriousMD, I built a data warehouse before we knew what we'd use it for. The first real question was whether any of it was accurate. A warehouse full of our own numbers proves nothing on its own. We needed to test it against something fair, something we didn't control.
SeriousMD is mainly a private doctor network. It isn't a census, and it will never fully represent every Filipino. So before we say anything about health in the country, we wanted proof our data could see it.
We landed on dengue. It's endemic in the Philippines, rises every rainy season, and puts pressure on clinics, hospitals and supply chains every year. It's mostly seen in clinics, and the government publishes the counts. Dengue came with an answer key.
If our data can see dengue the way the national record does, it can add to how we understand health in the country.
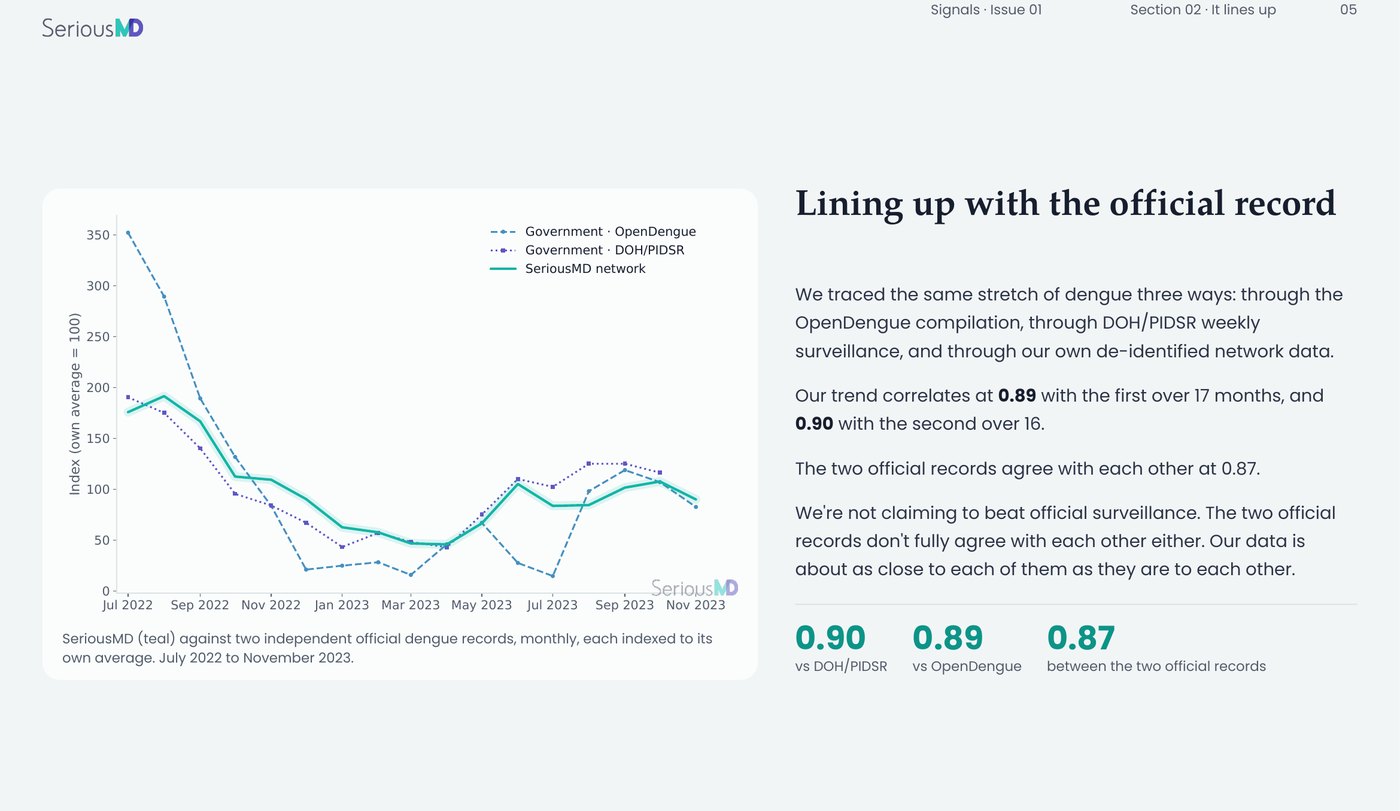
Lining up with the official record
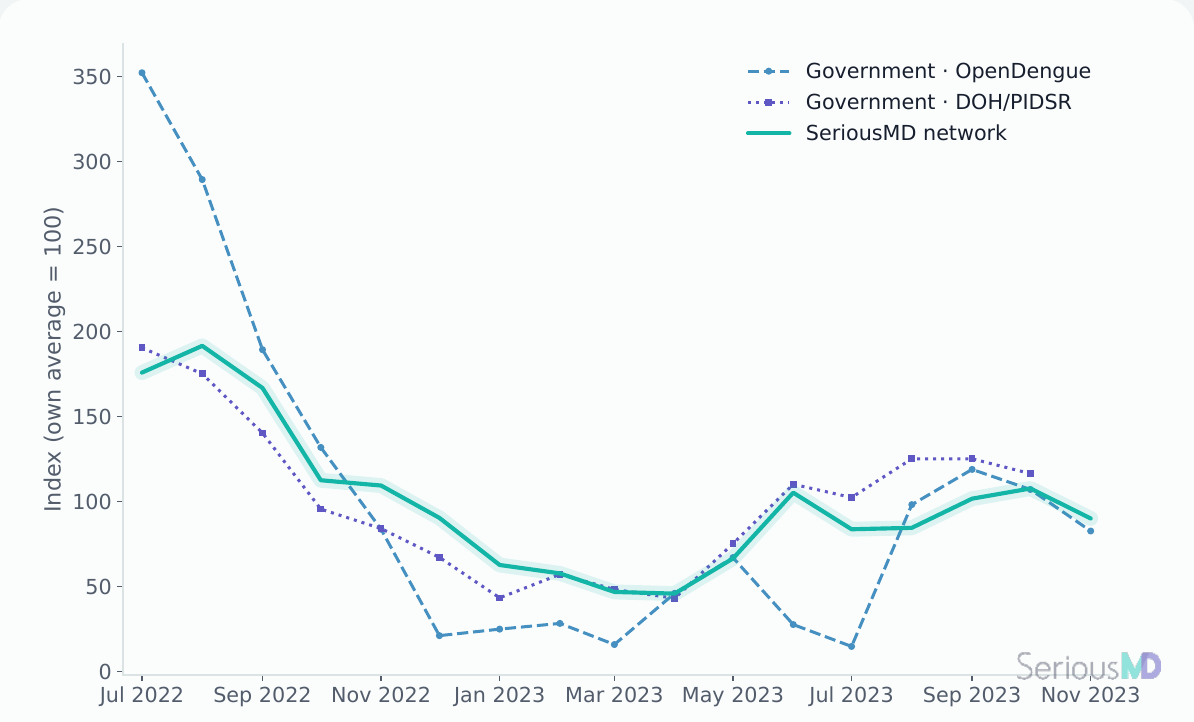
Sources: DOH/PIDSR weekly disease surveillance (Philippine Epidemiological Data, Mendeley); OpenDengue (Scientific Data, 2024).
Across that sample, from July 2022 to November 2023, our monthly dengue trend moved almost in step with national surveillance, with a correlation of 0.90 against DOH/PIDSR and 0.89 against the OpenDengue compilation. The two official records match each other at 0.87. We were about as close to each official record as the two records were to each other.
Since late 2023 there's no weekly official count to compare with. Our data has still moved in the same direction as DOH's periodic summaries: a big 2024, and a 2026 running well below last year. That's a weaker check, and the report says so.
The full 13-page report has all three tests, how our data scored on each, and every limit we know about.
Get the full reportMore like a traffic app, not a forecast
A traffic app shows EDSA backing up right now, before any official traffic report comes out. Our data does the same for dengue. It tells you where you are in the season today. We call that a nowcast.
What the app can't tell you is whether today is worse than a normal Friday. That's a different and harder question. It's an early warning: knowing a week is unusually bad for that time of year. Our data can't show that yet, and it doesn't count cases either.
| Question | What it means | Our answer |
|---|---|---|
| Direction of the season | Is dengue rising or falling? | Yes. Our monthly trend matched both official records, July 2022 to November 2023. |
| Early warning | Is this week unusually high for the time of year? | Not shown. We thought we had one at first, but it didn't hold up. The report shows how we caught it. |
| Forecast | What will next month look like? | No. We haven't tested it, so we don't claim it. |
| Case counts | How many Filipinos have dengue? | No. We measure dengue as a share of diagnoses in our network, not a count of cases. |
What we do have is already useful. Official figures take time to compile and publish; our data comes in as doctors see patients. Knowing where the season is now, without waiting for official figures to be published, is enough to plan around.
Why this matters
What we're really after is a clearer picture of national health. We want to build it from what doctors see every day, one condition at a time, and check each piece against the official record. Dengue is the first piece.
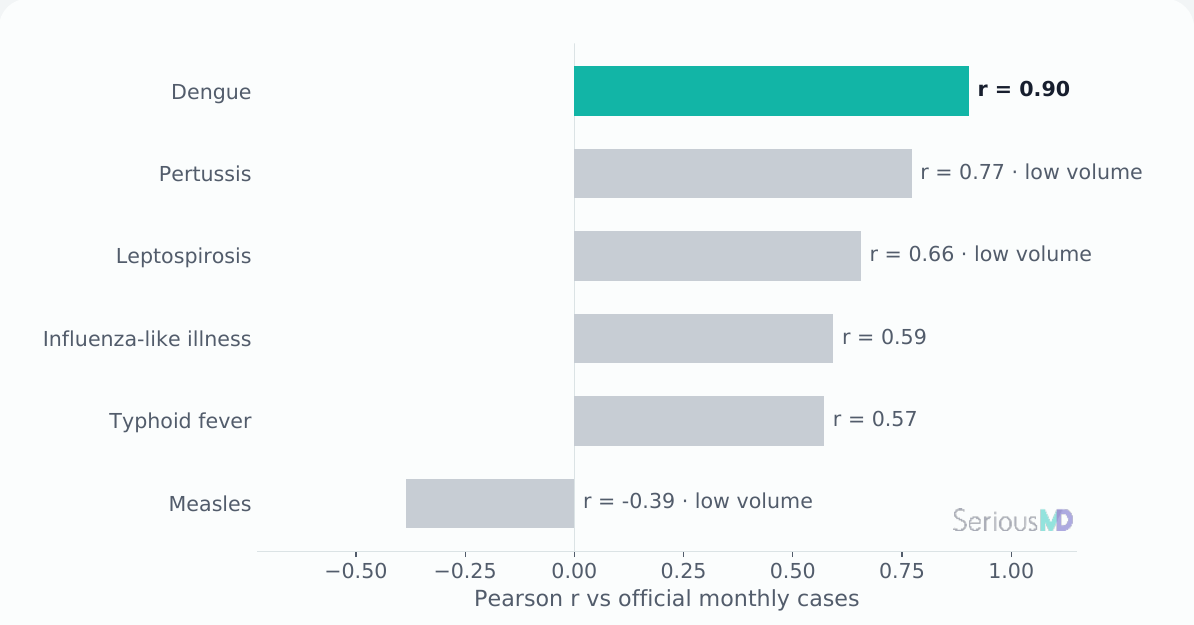
We ran the same test on five other diseases. Most didn't line up, and the reasons were telling. Some, like measles and typhoid, are mostly diagnosed in hospitals, not clinics. Others are too rare in our numbers to say much. So the honest scope is narrow and specific: common, seasonal conditions managed in clinics. Dengue is the proof. The other five show the limits. That's still the kind of condition many therapy areas live in.
Official health data is the reference, but it takes time to compile, and decisions don't wait. A doctor network can sit beside official surveillance and give a faster read to anyone planning around a season, from public health teams to supply chains. Our data doesn't wait on a reporting system. It comes from doctors seeing patients and writing diagnoses every day.
For pharma and health organizations, that opens practical questions:
- When is a season building, so teams can stock fever and hydration products or diagnostic kits ahead of demand?
- What do treatment patterns for a condition look like across the network?
- Do patients come back for follow-up?