
So now you’ve implemented your EHR. What comes next? The obvious answer is supporting it.
We’ve noted before that EHR implementation is a process. In fact, it’s one that tends to “take” better if it’s gradual and patient instead of deadline-driven and hasty. So, it can be counter-productive to think of implementation as something done and over with in a flash.
A smart implementation process always includes tracking the EHR post-launch and support. It is during these stages that you purport to answer questions like these:
- Is the EHR improving my practice?
- Has the EHR affected productivity?
- Has the EHR affected efficiency?
- Are my patients actually getting better treatment or care?
- Are the staff getting accustomed to the EHR?
- Is there still resistance to the EHR among the staff? Why?
Answering questions like these helps you fine-tune your implementation. It lets you see where you need to make changes, where you might need help, and so on.
How to Track the EHR

If you have reviewed the literature on this at all, you would know there are a lot of ways to track an EHR after it launches. A lot of performance metrics can be used. Which ones you do track may depend not just on your interests but also your resources:
Raw Volume
This can be an important metric to track for fee-for-service practices. It could help give you an idea of productivity pre- and post-EHR.
One way to track it would be to count the number of patient visits each day for a month, then average the number.
For example, let us say a practice tallies up its total patient visits for June and gets the number 465. They then have to divide that by the number of days for that month (30). The result (15.5) is the average number of visits per day for June.
Get a figure for pre-implementation at least a month before the EHR launches. Better, figures for several months pre-implementation, to give you better comparative data.

The number of patients you see a day can help you understand if you are being more or less productive on an EHR, especially for fee-for-service practices.
For post-implementation, get it more than once, i.e. spaced out over several intervals. This is since your staff will need a “settling in” period. You will likely see different values 6 months post-launch and 1 year post-launch.
As such, it would be wise to get post-launch numbers 2 – 3 times over an extended period. This is true of practically all of the factors for tracking, so do it for all of them.
Remember to avoid getting figures for months that are typically associated with sharp spikes or dips. For instance, do not bother counting visits for December or January, as most practices see higher numbers then owing to holiday emergencies.
Cost-efficiency
There are a lot of ways to measure this, but the basic one is to go with overhead per month. Things you need to consider when calculating the overhead pre- and post-launch include these:
- Total number of employees and total value of their salaries
- Medical and office supply costs
- Rental and storage costs
- Insurance costs
- Third-party services (e.g. billing services)
Collect the numbers for a month and compare the pre- and post-launch sums.
Profit Productivity
This might be measured by getting the total deposits for a month and dividing the number by the total number of visits for the same month. The sum should give you your total earnings (in pesos) per visit. Again, get figures pre- and post-launch.
Note that this is a rough figure, though. You may have to perform an overhead cost calculation for that month too and compare it to the month’s revenue for a better idea of actual profit.
Time Spent on Activities
This could help you figure out how the EHR has affected time efficiency. Take note that there are several activities you may want to monitor. For example:
- Time spent creating an appointment
- Time spent pulling files
- Time spent charting
- Time spent sending non-urgent messages, e.g. SMS or call reminders to patients
For #2, include the time that elapses from the moment a file is requested/needed to the time it is pulled up. This is because the files you need may not always be in the same building or your immediate vicinity when you require them. The time spent waiting for them to arrive has to be considered too, for physical (paper) files.
As for time spent charting (#3), it can be tricky to measure. Most of the literature indicates that physicians spend more time charting post-launch, for instance. This could be partly due to factors like inadequate training or settling-in time for the EHR, yes. But it could just as easily be due to something one study has termed “cognitive dissonance”.
In that study, most physicians felt that their charting time had increased due to an EHR. However, the same physicians also reported being able to either see more patients or leave their practices earlier in the day than before they used the EHR.

While 66% of doctors in the study felt they spent more time charting on an EHR, the same percentage also felt they still spent the same number of hours working as opposed to having a longer workday.
The study posited that this phenomenon could be partly because EHRs consolidate so many functions. Tasks like lab result review and prescription become digital too instead of paper-based.
Because they are all handled from a single interface as well (thanks to the EHR), physicians may inadvertently begin considering those tasks part of “charting duty”, even though they would have been considered separate tasks before. Little wonder they think they spend more time charting, then.
What does this mean for you? First, this suggests that you may want to define from the start what falls under “charting”. That definition needs to be equal for both the pre- and post-launch data collection phases. If prescription was not considered “charting” pre-launch, for instance, do not consider it when counting time spent on charting post-launch.
You may also want to include notes in your time logs for where you were charting. Most physicians chart both in and out of the office, after all. For example, you could have 2 columns for the time logged, one for time spent charting at the office and one for time spent charting elsewhere.
For those who have charts semi-filled in by others, you should also note which charting hours were logged by whom, e.g. if it was a physician or a nurse. An even better idea might be to have each staff member keep his/her own charting time log if everyone pulls charting duty at your practice.
Finally, you may want to consider noting what time you get home every day during the monitoring period (to see if you go home earlier or later post-launch). This usually figures in physicians’ considerations of efficiency and productivity, after all.
Here is a sample log:

Quality of Care
This is very hard to measure since so many things go into it. A few possibilities include these:
- The number of medical errors committed by your practice over a period of time (say, 6 months).
- Patient satisfaction with your care via survey (obviously a subjective measure, but it can still help).
- The ratio of positive outcomes to negative outcomes (more useful for surgical practices or hospitals).
The thing about quality of care is that most of the other factors here affect it. You may want to sit down and talk with your staff (and even your patients) to determine how best to measure it at your practice.
A Caveat: Tracking Methodology Affects Data

When investigating your practice’s implementation, remember that the way you gather your data has to be under scrutiny too.
Keep in mind that the way you track each metric can affect your results.
Consider “time spent charting”, for example. If you track this through self-reported figures (where staff/physicians simply “time themselves” while charting and report the data afterwards), you are very likely to get skewed results.
People’s biases as well as subjective perceptions affect self-reported data very strongly. You have no guarantee either that they are using actual timepieces instead of simply making estimates. Nor that they are using the same rules for “timing”, e.g. starting and stopping at the same points per charting session.
On the other hand, were you to use something like video recording technology, that would probably supply more accurate results. Even more so were you to use standard research time and observer methodology.
But again, you might not have the resources to devote to more precise means of data collection. If so, it is perfectly fine to make do with what you have… provided you acknowledge the potential weaknesses of it.
What to Do With Your Data
In two words: analyze it. Compare pre- and post-launch figures. Have there been dips where you do not want to see any? Spikes in numbers you have been hoping for? Remember that all these figures are intended to help you answer more practical questions, like these: Are there areas where improvements might be made? How can they be made?
Most of the time, improvements can be achieved with better training and team openness. Getting vendor support is useful, but you too have to provide support for your team. That means listening to pain points and considering them with care.
Keep in mind, by the way, that you do not want to stifle complaint. You want to address it. There is a difference between fixing a problem and turning a deaf ear to it.
Discouraging staff from speaking out about their woes will only hinder your implementation. Even when you feel that some of the complaints you are hearing are merely “cultural carping”, you still want to listen to them. Not only does that ensure you can brainstorm together how best to use the EHR; that way, you can foster respect and help staff overcome issues instead of telling them to deal with it all alone.
A good idea might for dealing with cultural resistance might be to take implementation incrementally. Making changes little by little, at a rate acceptable for most users, is better than enforcing a hard deadline for the implementation.
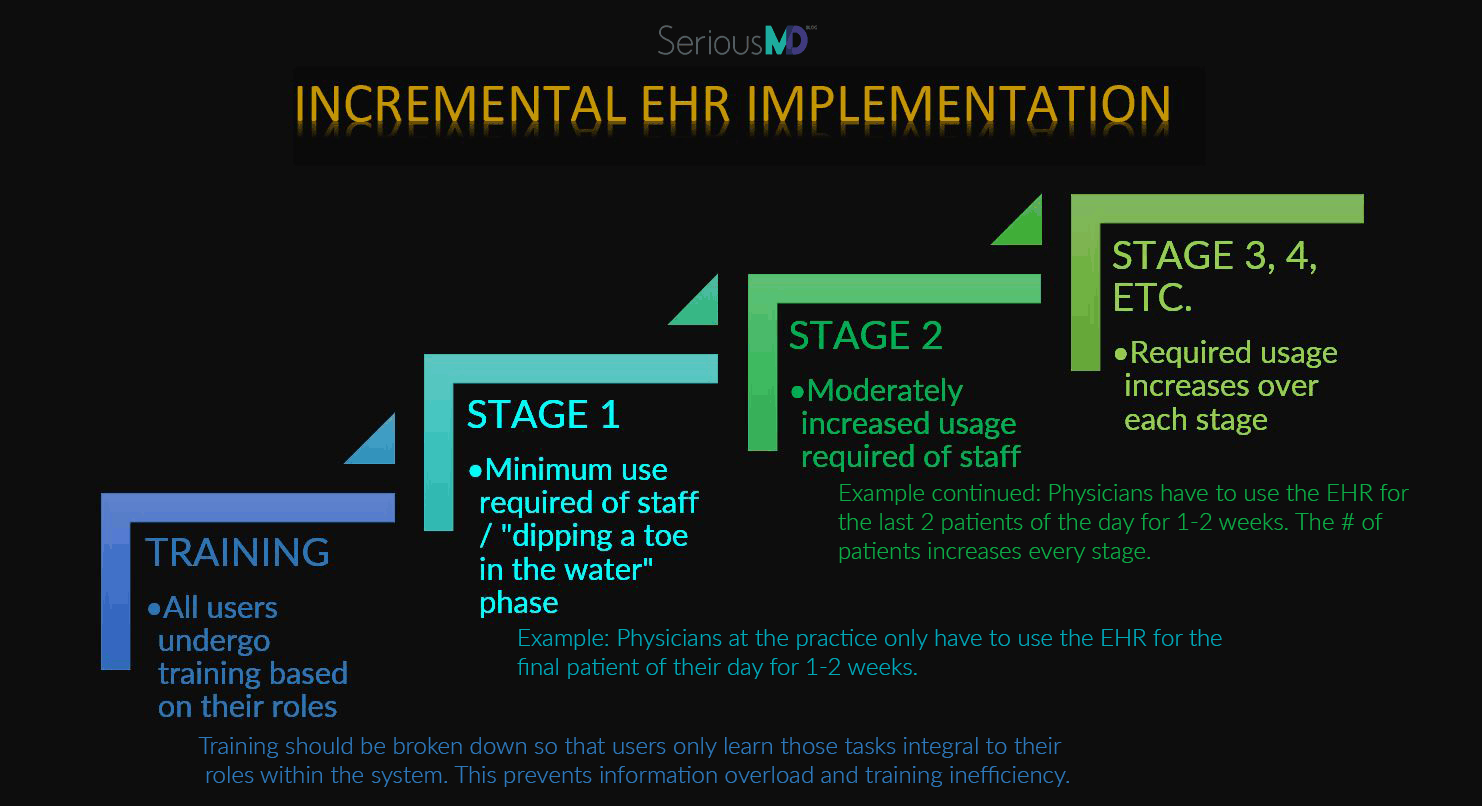
An incremental or gradual implementation might proceed along these lines.
For instance, you could start by having each physician/staff at the practice test the EHR with only one patient for a week or so. Ideally, it would be the last patient of the day. That way, any slowdown due to them getting used to the new system would not affect the rest of the patients for that day.
After a week or two, users should have sufficiently acclimated themselves to the EHR to move up to 2 patients on it per day. Another week and it should go up to 3 patients per day.
Eventually, you should find everyone gamely using the EHR for all patient visits. And if there are still some having trouble with it, make allowances! Let them proceed at their own pace. It is likelier to produce better results.
Patience and responsiveness count for a lot in times of change. This is true of EHR implementation. Cultivate feedback systems, listen to your staff, and don’t be afraid to ask for help from your vendor if you really need it.
If you want to learn more about how you might do all of this and implement an EHR at your practice, talk to us here. We can help you figure out how best to negotiate the transition from healthcare’s past to its future.